Session Timeline
A live Gantt of every Claude Code session, read straight from local transcripts
A browser dashboard that puts every Claude Code session on one shared time axis — when the agent was working, when the human was reading, every tool call and every subagent run. It reads the transcripts already on disk, so there are no hooks to install, no config to change and no dependencies to audit.
The problem
Run a coding agent seriously and you quickly lose the plot on your own workflow. How many sessions were actually running in parallel? Where did the wall-clock time go — the agent working, or you reading? Which runs spawned subagents, and for how long?
The data already exists: Claude Code writes a transcript for every session under
~/.claude/. Nothing reads it back.
What it does
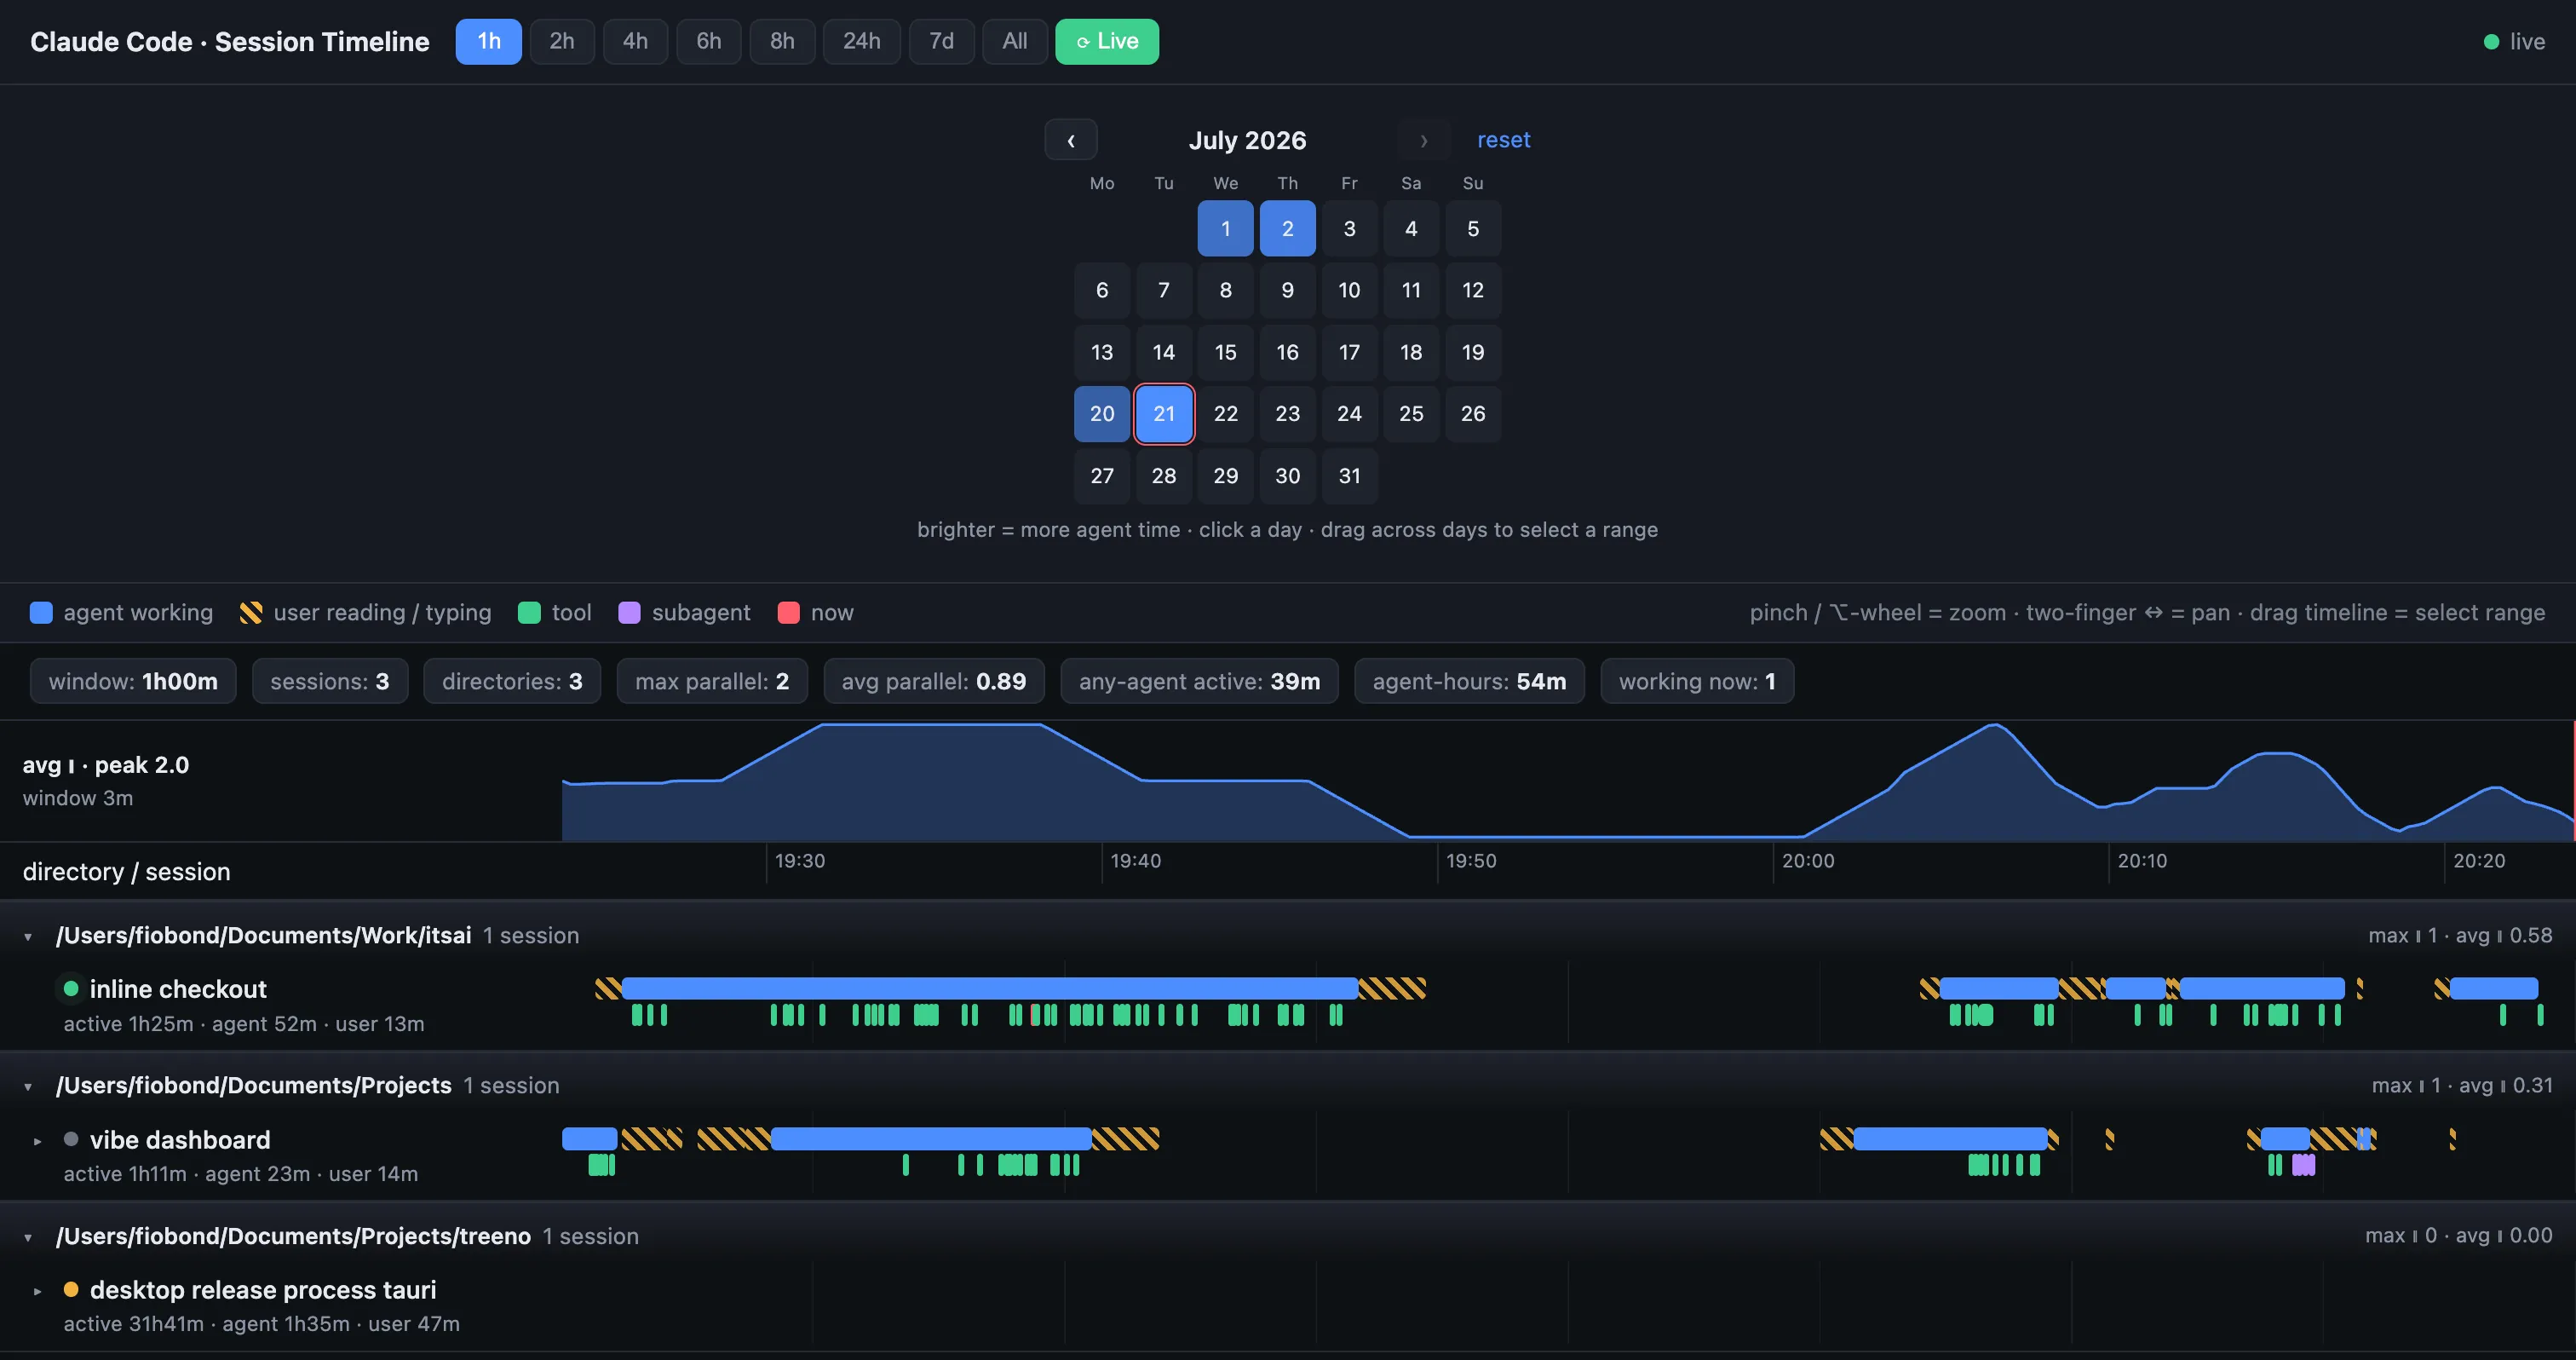
Every session becomes a row on one shared time axis, grouped by working directory, with four lanes: agent working, user reading or typing, every tool call, and every subagent run. Above the timeline is an average-parallelism chart; below it, a stats bar for max and average parallelism, any-agent-active wall clock, agent-hours and what is running right now. A month heatmap gives one square per day, brighter for more agent-active time.
Everything recomputes for whatever window you are looking at, or for any range you drag across.
How it stays honest
Live without hooks. The server tails ~/.claude/{projects,sessions,jobs} and
pushes a change event over SSE, so the board redraws as sessions run. Nothing is
injected into Claude Code itself — install it, delete it, and your setup is
unchanged either way.
Estimated time is labelled as estimated. Claude Code logs no keyboard signal, so human reading and typing spans are modelled from prompt length and agent output, then de-conflicted so two parallel sessions never claim the same person at the same moment. It is a model, and the README says so.
It refuses to guess the rest. Passive scrolling and switching chats without acting leave no trace anywhere in the transcripts — so idle gaps between turns are left blank rather than filled with a plausible-looking span. A dashboard that invents data is worse than one with holes in it.
Notes on the build
Zero runtime dependencies was a deliberate constraint, not a flex: this reads a directory full of your own working history, and a tool like that should be small enough for someone to actually read before running it. The timeline rendering, zoom and pan, range selection and heatmap are all hand-written against browser APIs. An optional macOS LaunchAgent starts the server at login and restarts it if it crashes.